Congratulations! You’re just one step away from effectively monitoring your website’s SEO performance with our Free Google Search Console Looker Studio Dashboard. Designed to simplify your data analysis process, these dashboards empower you to make data-driven decisions and optimize your digital marketing strategies.
We at Rasel Digital are thrilled to be part of your journey toward business growth by providing intuitive and insightful tools. Beyond Google Search Console, we also offer free dashboards for GA4, Google Ads, Google Business Profile, and YouTube, giving you a complete overview of your online marketing performance across platforms.
Step 1: Select a Google Search Console Account
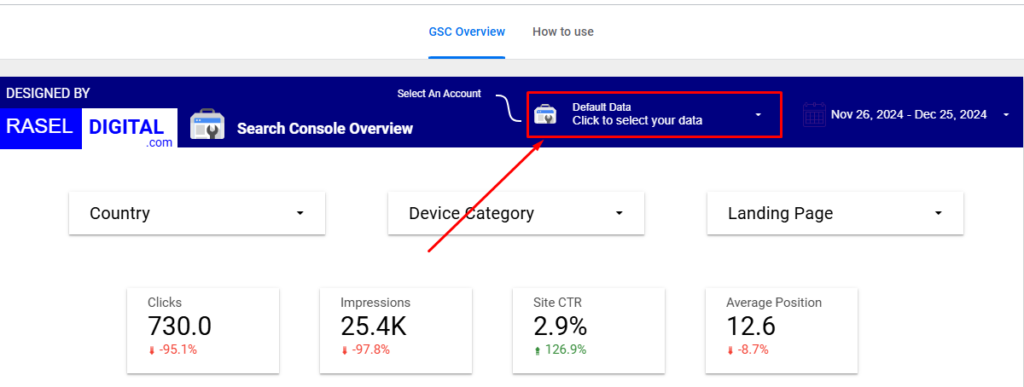
To get started, ensure you have access to a Google Search Console account through your Gmail. Select the account you want to analyze, and our dashboard will seamlessly pull in the data to provide a comprehensive view of your website’s organic performance.
Step 2: Explore the Dashboard’s Key Features
Our Google Search Console Dashboard is packed with powerful features and visualizations that make tracking your SEO metrics a breeze.
Filters for a Customized Experience:
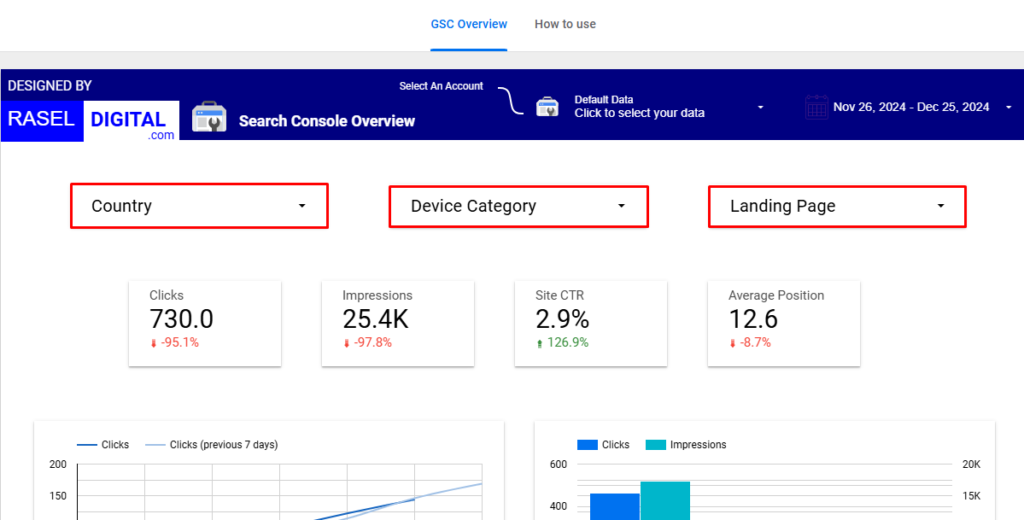
Use our advanced filters to narrow down the data and focus on specific aspects of your SEO performance:
Device Category: Analyze how your website performs on desktop, mobile, and tablet devices.
Country: Dive into regional insights to identify high-performing markets and growth opportunities.
Landing Page: Track the performance of individual pages to refine your on-page SEO strategy.
Essential Metrics and Dimensions Tracked:
Our dashboard highlights the most critical SEO metrics, including:
Impressions: See how often your site appears in search results.
Clicks: Measure the organic traffic driven to your site.
Site CTR (Click-Through Rate): Evaluate the effectiveness of your metadata in capturing attention.
Average Position: Monitor your rankings in search results and identify areas for improvement.
Step 3: Leverage Interactive Visualizations
The dashboard includes various charts and tables to make data analysis intuitive:
Country Table: View impressions, clicks, CTR, and average position segmented by country to evaluate performance across regions.
Device Category Pie Chart: Visualize traffic distribution across devices to optimize for mobile or desktop users.
Query Table: Analyze search queries that drive impressions and clicks to identify top-performing and opportunity keywords.
Landing Page Table: Understand which pages drive the most traffic, enabling you to enhance their content and rankings.
Step 4: Use the Insights to Drive SEO Success
Our dashboard is not just about tracking metrics; it’s a powerful tool to help you make actionable decisions. Here’s how you can use it to your advantage:
Optimize underperforming keywords and landing pages based on query and page data.
Refine your regional strategy by focusing on high-performing countries.
Improve your mobile and desktop experiences using device-specific insights.
Monitor and adjust your metadata to boost click-through rates and rankings.
Why Use Our Dashboards?
Our dashboards are completely free and designed to save you time and effort by simplifying complex data. They provide an intuitive, interactive, and comprehensive way to analyze your SEO performance without the need for advanced technical skills.
Get Started Today
If you have questions or need assistance, our team at Rasel Digital is here to help—don’t hesitate to contact us!
Start optimizing your digital marketing performance and achieve your business growth goals with ease!