
The YouTube Overview Dashboard is a powerful and user-friendly tool designed to help content creators, marketers, and businesses monitor and analyze the performance of their YouTube channels. It provides an at-a-glance summary of essential metrics and insights, enabling users to track their progress, understand audience behavior, and make informed decisions to optimize their content strategy. Here’s a detailed breakdown of the key features and components of the YouTube Overview Dashboard:
1. Main Metrics Overview
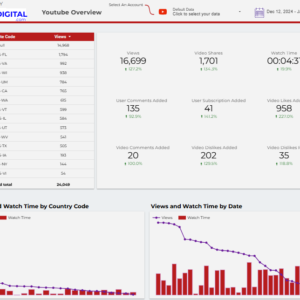
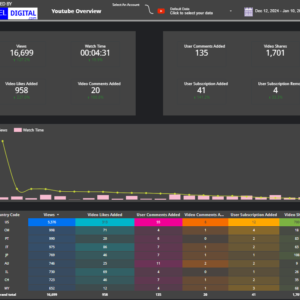
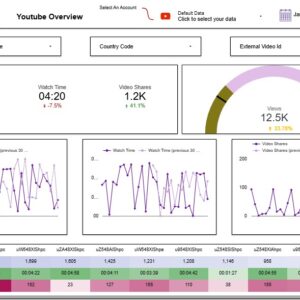
At the top of the dashboard, users can find a concise summary of the most critical metrics for their channel. These typically include:
- Views: The total number of times your videos have been watched during the selected time frame.
- Watch Time: The cumulative amount of time (in hours) viewers have spent watching your content.
- Subscribers: The net gain or loss of subscribers, showing how your content is influencing audience growth.
- Estimated Revenue (for monetized channels): Displays earnings generated from ads, channel memberships, Super Chats, and other revenue streams.
2. Audience Engagement Insights
This section provides insights into how audiences are interacting with your content. It includes:
- Top Videos: A ranked list of your most-watched videos, helping you identify what resonates with your audience.
- Likes, Comments, and Shares: A breakdown of engagement metrics, which show how viewers are reacting to your content.
- Average View Duration: The average amount of time viewers spend watching your videos, a key indicator of content quality and relevance.
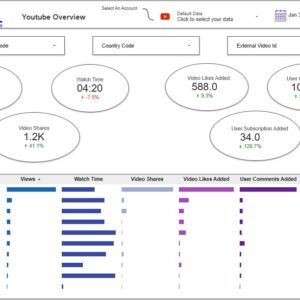
3. Traffic Sources
Understanding where your viewers are coming from is vital for growing your channel. The dashboard provides:
- External Traffic: Views coming from websites or platforms outside YouTube, such as social media or blogs.
- YouTube Search: Performance based on specific keywords and phrases that lead to your videos.
- Suggested Videos: Traffic generated from recommendations on other YouTube videos.
- Browse Features: Views from YouTube’s homepage, subscription feed, or other browsing areas.
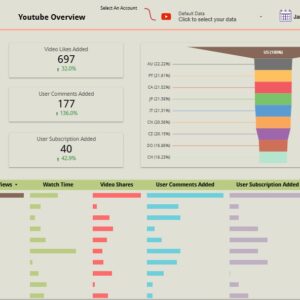
4. Audience Demographics
This section gives a detailed profile of your viewers, helping you tailor your content to their preferences. Metrics include:
- Age and Gender: Shows the percentage of viewers by age group and gender.
- Geography: Provides information on where your viewers are located, often displayed on an interactive map.
- Language Preferences: Helps you understand which languages your audience prefers, guiding you in creating subtitles or localized content.
5. Real-Time Analytics
This feature provides live data on how your videos are performing at the moment. It includes:
- Real-Time Views: A live graph showing views in the past 48 hours, broken down by hour.
- Top Performing Videos: Videos currently driving the most views, allowing you to capitalize on trends.
6. Revenue Analytics (Monetized Channels
For creators enrolled in the YouTube Partner Program, this section breaks down earnings by:
- Ad Revenue: Earnings from YouTube ads placed on your videos.
- Transaction Revenue: Income from channel memberships, Super Chats, and Super Stickers.
- Estimated Monetized Playbacks: The number of times ads were shown on your videos.
7. Content Performance
This part dives into how well specific types of content are doing, allowing you to refine your strategy. Metrics include:
- Video Format Performance: Performance comparison between regular videos, Shorts, and live streams.
- Click-Through Rate (CTR): Percentage of viewers who clicked on your video after seeing its thumbnail and title.
- Retention Rates: Insights into how long viewers stay engaged with your videos.
8. Customizable Time Frames
The dashboard allows users to view data for various time periods, such as the last 7 days, 28 days, 90 days, or a custom date range. This flexibility helps creators analyze trends over time and make informed decisions.
9. Comparisons and Benchmark
You can compare current performance with past periods or set benchmarks to measure growth. For example:
- Compare current week’s views to the previous week.
- Analyze year-over-year growth to assess long-term progress.
10. Downloadable Reports
The dashboard enables users to export data in CSV format for deeper analysis or sharing with team members. This is particularly useful for marketers and businesses managing multiple channels.
11. Mobile and Desktop Accessibility
The dashboard is optimized for both desktop and mobile devices through the YouTube Studio app. This ensures creators can stay updated on their channel performance anytime, anywhere.
12. Actionable Recommendations
To help creators improve their performance, the dashboard often includes:
- YouTube Tips: Suggestions for optimizing titles, thumbnails, or descriptions.
- Audience Recommendations: Insights into the best times to post or topics that may resonate with your viewers.
Conclusion
The YouTube Overview Dashboard is an indispensable tool for anyone looking to grow their channel and maximize engagement. By providing clear, actionable insights into video performance, audience behavior, and revenue generation, it empowers creators to make data-driven decisions and continuously refine their content strategy. Whether you’re a beginner or a seasoned YouTuber, leveraging the features of this dashboard can lead to significant channel growth and success.
If you need any help or have questions, we’re here to assist you—feel free to contact us for support!
Reviews
There are no reviews yet.